Introduction
What is LLMonade?
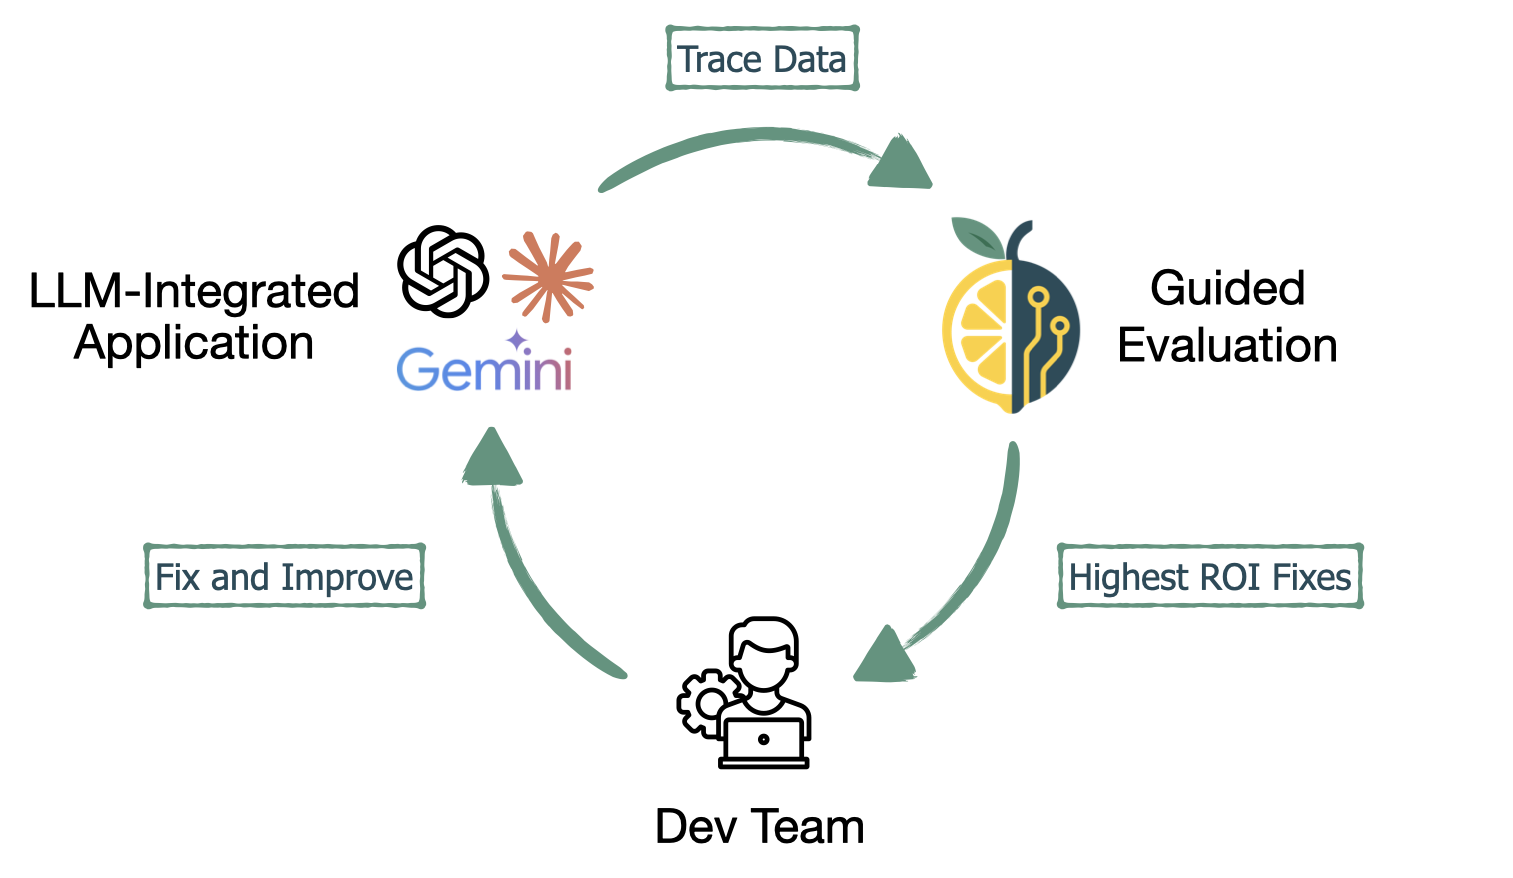
LLMonade is an open-source AI evaluation tool that helps small development teams systematically improve their LLM-integrated applications through guided, manual error analysis. The streamlined interface pulls real trace data, allows for quick annotation of outputs, automatically categorizes failure patterns, and identifies the highest ROI fixes. LLMonade’s step-by-step approach empowers teams new to AI evaluation to adopt the proven best practice of manual error analysis.
Background
Deterministic Applications
In traditional applications, software that does not involve AI, developers work with systems that are deterministic. A deterministic application follows rule-based logic where the same input, under the same conditions, always produces the same output. The same URL will always route to the same endpoint. A function either returns the expected output, or it does not. Static templates render the same data every time the user logs in, or an error is returned. Observability and testing verify that deterministic systems are operating as expected.
Observability in Traditional Applications
Observability measures and infers the internal state of a complex system based solely on the data it produces. Traditionally, observability has three pillars:
- Metrics - Represent numerical data points that quantify system performance over time.
- Logs - Context-rich records of specific events within an application that include both user defined logs and uncaught exceptions.
- Traces - A log of events, usually the end-to-end journey of a single request as it flows through multiple services in a distributed system. They are composed of a series of timed operations, where each individual operation is captured as a span. This end-to-end visibility of a single request is crucial for understanding where a problem has occurred.
Metrics, logs, and traces work together to show a complete picture of where a developer can improve their application. Metrics identify what issues are occurring, logs provide context about specific events, and traces pinpoint where the problem originated.
Testing Traditional Applications
The deterministic nature of traditional applications enables developers to write precise assertions that definitively validate application behavior. These assertions are built into test suites, which specify and enforce an application's correct behavior. Correctness in traditional software is not a matter or opinion or quality; it is a binary, proven state.
Improving Traditional Applications
The improvement process for traditional software is a direct, logical, and repeatable cycle of debugging and fixing.
A Bug is Identified: A problem is found either through testing, user feedback, or an alert from the observability system ("The error rate just spiked!").
The Code is Debugged: A developer uses logs, traces, and debugging tools to find the exact line of code that is causing the problem.
A Direct Fix is Applied: The developer changes the explicit logic of the code.
The Fix is Verified: The developer re-runs the tests to prove that the bug is gone and that the fix didn't accidentally break anything else (a "regression").
The Fix is Deployed: The updated code is released to users.
The effectiveness of this entire cycle is fundamentally rooted in the deterministic nature of the software.
Artificial Intelligence and Large Language Models
Artificial Intelligence (AI) is a broad field encompassing machines and software capable of performing tasks that typically require human intelligence, such as reasoning, learning, planning, perception, and understanding language.
Large Language Models (LLMs) are an increasingly popular and powerful subset of AI applications. They are trained on an enormous amount of text to recognize patterns in language and generate human-like responses based on a given input. LLMs enable both new ways of interacting with existing applications through natural language and entirely new classes of applications.
The input provided to an LLM is called a prompt. A prompt is simply the instruction, question, or text you give to the model to get it to do something. It is the starting point that guides the AI toward the response you want. The output is the response the LLM generates after processing your prompt. This is the text, code, or other content that the model creates for you.
Prompt engineering is the process of carefully crafting and refining the instructions given to an LLM to ensure it performs a task accurately, safely, and consistently. It is the primary and most direct control surface for steering an LLM’s behavior.
LLM-Powered Software
LLM-based applications integrate LLM capabilities into traditional software workflows. The most popular use cases today include chatbots, content creation, and code generation. The use of the LLM in the application can be as simple as a single request to an LLM. Alternatively, the use could be much more complex. This could include calls to multiple LLMs, or even provide tools for an LLM to utilize at its own discretion.
The Non-Deterministic Nature of LLMs
LLMs are non-deterministic, meaning that identical inputs can yield different responses. At its heart, an LLM is a prediction engine. When you give it a prompt, it doesn't search a database for a pre-written answer. Instead, it randomly selects from the next most likely words, one after another, based on the vast amount of text it was trained on. Think of it like a very advanced autocomplete.
How this differs from traditional applications becomes clear when considering a simple example. In a traditional application, a user profile query either returns the correct user data or fails with an error. With an LLM-powered application, the same query might return a correct response, partially correct information, completely fabricated data (hallucination), properly formatted responses with incorrect content, or numerous other combinations of expected and unexpected responses.
In each of these scenarios, the LLM returns what looks like a valid response. Thus, traditional monitoring tools would report all of them as "successful" requests, with acceptable latency and no error codes. Consequently, new methods and tools are required to determine if an LLM-based application is behaving correctly.
Observability in LLM-Powered Software
Observability in LLM-based applications includes and expands on the metrics, logs, and traces used in deterministic applications. Metrics expand from system performance to include AI quality and cost, while logs shift from capturing system events to recording the multi-step journey of inputs and outputs. Traces and spans capture essential details about an LLM-based applications behavior.
- Traces - A log of events, usually the end-to-end journey of a single request as it flows through multiple services in a distributed system. They are composed of a series of timed operations, where each individual operation is captured as a span. This end-to-end visibility of a single request is crucial for understanding where a problem has occurred.
- Spans - A span represents a single, distinct operation or unit of work within a trace. In a request to an LLM-powered application, spans represent a single logical task in the sequence (e.g., a vector search, a call to an LLM, a data transformation).
- Root Spans - A root span is the topmost span. It encapsulates the request from start to finish. The input will be the initial input from the user, and the output of a root span will be the final output that is returned to the user after any intermediate steps or tasks are completed.
Traditional Testing of LLM-Powered Software
In an LLM-powered application traditional unit tests are still an effective part of testing. Unit tests can be used to test all of the deterministic code around the LLM piece of your application. Assertions can also be used to test the output of your LLM calls by checking the structure or format, checking the length of the output, checking for key phrases, and security checks for sensitive data. Although they involve a network call, they can be referred to as unit tests because they test a specific piece or feature of your application.
Evaluating LLM-Powered Software
To understand if your LLM-integrated application is functioning "correctly", traditional tests meant for deterministic software are not enough. Instead of a static, singular, correct output, there are a variety of outputs that can all be considered correct. Thus, in addition to traditional binary tests, one must also judge the quality and acceptability of the application's probabilistic outputs. This type of test is called an evaluation.
The two most powerful ways to evaluate an LLM-based application are manual human error analysis and LLM-as-a-Judge. A large production application, with full test coverage, would likely include a combination of unit testing with assertions, manual error analysis, and LLM-as-a-Judge evaluation.
Manual Human Error Analysis
Manual human error analysis is the process of looking at real traces from an application, annotating errors found in each trace, categorizing those errors into distinct categories, and finding the most common failures. By finding the most common errors, developers can now make targeted improvements to their application. Additionally, they can create custom LLM-as-a-Judge evaluation tests that are targeted to the most common errors.
LLM-as-a-Judge
When evaluating LLM applications at scale, having a human annotator evaluating every output becomes infeasible. By using LLMs as evaluators, teams can automate quality control at scale. LLM-as-a-Judge is an evaluation technique that leverages LLMs to assess the quality, relevance, and reliability of outputs generated by an LLM-powered application.
"Manual inspection of data has probably the highest value-to prestige ratio of any activity in machine learning."
Emerging Best Practices
Don't Skip Error Analysis!
Hamel Husain is an ML Engineer and researcher with a proven track record shipping seminal LLM work and helping teams rapidly improve their AI powered applications. One of the recurring themes in Hamel's writing is the importance of manual error analysis. In his words, "Error analysis is the single most valuable activity in AI development and consistently the highest-ROI activity." He elaborates, "In the projects we've worked on, we've spent 60-80% of our development time on error analysis and evaluation."
Error analysis is one of the most frequently skipped or superficially performed steps in the AI development lifecycle, especially by teams that are new to building with LLMs. Hamel says, "Many vendors want to sell you tools that claim to eliminate the need for a human to look at the data … The tools first mindset is the most common mistake in AI development. Teams get caught up in architecture diagrams, frameworks, and dashboards while neglecting the process of actually understanding what's working and what isn't."
Hamel cautions against using generic solutions, like prebuilt LLM-as-a-judge evaluators, without spending the time to understand an application's specific domain and problems. He suggests beginning with manual error analysis. Here is his advised workflow:
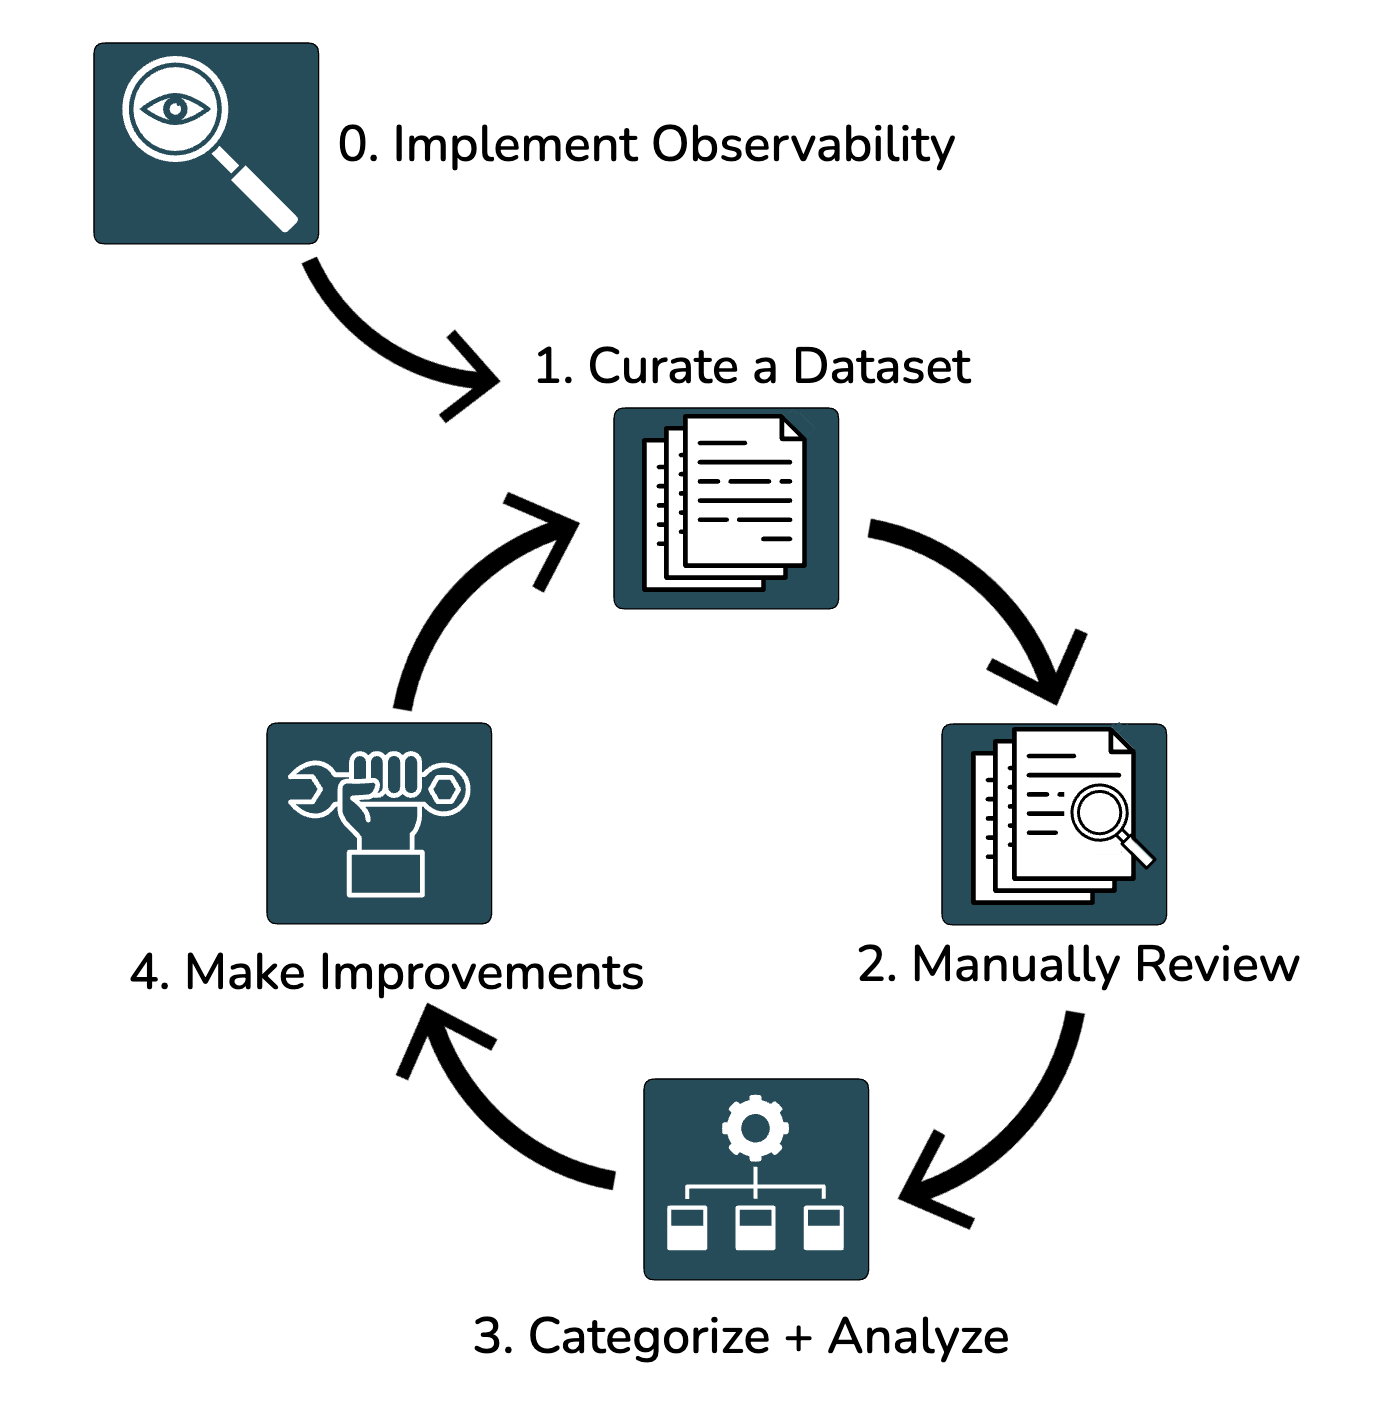
Error Analysis Workflow
Implement Observability
Error analysis builds on basic observability. At a minimum, you need to collect the inputs and corresponding outputs that your application produces. The inputs consist of real-world examples of what users will ask your application. The outputs are the results produced by your application. This can be done by a simple logging mechanism or using existing LLM observability tools that store full traces.
Curate a Dataset
Once traces are being collected, the next step is to select the specific traces that you want to analyze. This should be anywhere from 10 to 100 traces. The more traces you look at, the more information you will glean from the process. The traces should be diverse and represent different parts of your system.
Human Review of the Data
Next, each pair of inputs and outputs should be manually reviewed. The review captures whether the response is positive or negative and includes free form annotation describing the most significant error found in the set. The reviewer needs to be someone that is capable of assessing the quality of the output. Sometimes this may be the developer, but other times it will need to be a domain expert that knows more about the specific subject at hand.
Categorize and Analyze the Data
Once all of the data has been reviewed, the annotations should be categorized by failure mode. An LLM can be used to create the categories from the free form notes and then put each piece of feedback into the correct error category. The result is a list of categories representing the errors found in the dataset and a count of how often they occur in the dataset.
Fix and Improve the Most Common Issues
Now that you have analyzed actual data from your application, you should have a much better idea of how it behaves. The failure modes that are most frequent in your dataset are a high ROI target for your application developers to fix. Prompt engineering is the most straightforward way to make changes to an LLM-based application. Other options can include changes to your code or changes to more advanced AI systems within your software.
Iterate
The entire process, from viewing your data to implementing fixes, is a cycle. Once an update has been made to your application, go back to the beginning, step 1, and start error analysis again. You should test similar inputs again until you are happy with the improvements. Then, continue working through this loop with new and varied inputs to find additional failure modes.
Post Error Analysis
There is no exact science on when to move on from error analysis. Shreya Shanker is an AI systems researcher in the UC Berkeley Data Systems and Foundations Group. Regarding error analysis, she recommends, "Collect representative examples and categorize failure modes. You must look at your data until you reach "theoretical saturation" - the point where reviewing additional examples reveals no new failure modes." Both Hamel Husain and Shreya Shankar advocate for starting with this manual, in-depth analysis of your data before building complex evaluation infrastructure.
Once the error analysis cycle has hit "theoretical saturation", the next step is setting up automated evaluations with LLM-as-a-Judge. You can now create custom evaluations that target the error categories that you have improved and/or fixed. The goal of the automated tests is to "lock in" your progress and ensure that these specific problems don't reappear in the future. They become regression tests.
Effective Human Review Interface
When performing error analysis, both Hamel Husain and Shreya Shankar emphasize the need for a well-designed review interface. While the reviewer must be a subject matter expert, they may not always be technically savvy. Thus, the interface is not meant to be a complex, feature-bloated dashboard, but rather a purpose-built tool that removes all friction from data inspection. The interface is designed to help rapidly select data and provide feedback.
Essential Components
- Unified Data View - All relevant information is displayed in one place, so an analyst doesn't have to hunt for context.
- Keyboard Shortcuts: Hotkeys should be built in to allow users to submit feedback and move quickly between traces.
- Binary Scoring: A straightforward thumbs-up/thumbs-down or pass/fail button to quickly gauge the quality of the output.
- Free-Form Notes: Open ended feedback lets the analyst capture nuanced issues that can later be categorized.
- Filtering and Sorting: Allows filtering and sorting to help the analyst select which data to review.
- Progress Indicator: When analyzing a set of traces, a progress bar shows how many input and output sets have been reviewed and how many are left.
- Context-Dependent Formatted Data: The inputs and outputs should be formatted similarly to how the user would view the data in production.
The ideal data viewer, as envisioned by experts like Husain and Shankar, is less of a generic logging tool and more of a bespoke, interactive workbench. It is built to be the fastest path to understanding where an LLM application is failing, empowering developers and domain experts to turn raw data into actionable insights. If you have the resources available, Husain and Shankar make the case for a custom review interface. For teams that do not have the resources to make a custom interface, they suggest using existing solutions to get started.
Existing Solutions
Two categories of tools can help with error analysis: AI evaluation software and data labeling platforms. AI evaluation software features a variety of options to observe, test, and evaluate traces from an AI-based application. Data labeling platforms are focused on annotation of traces and organizing those annotations. They do not collect traces or provide automated evaluations.
AI Evaluation Software
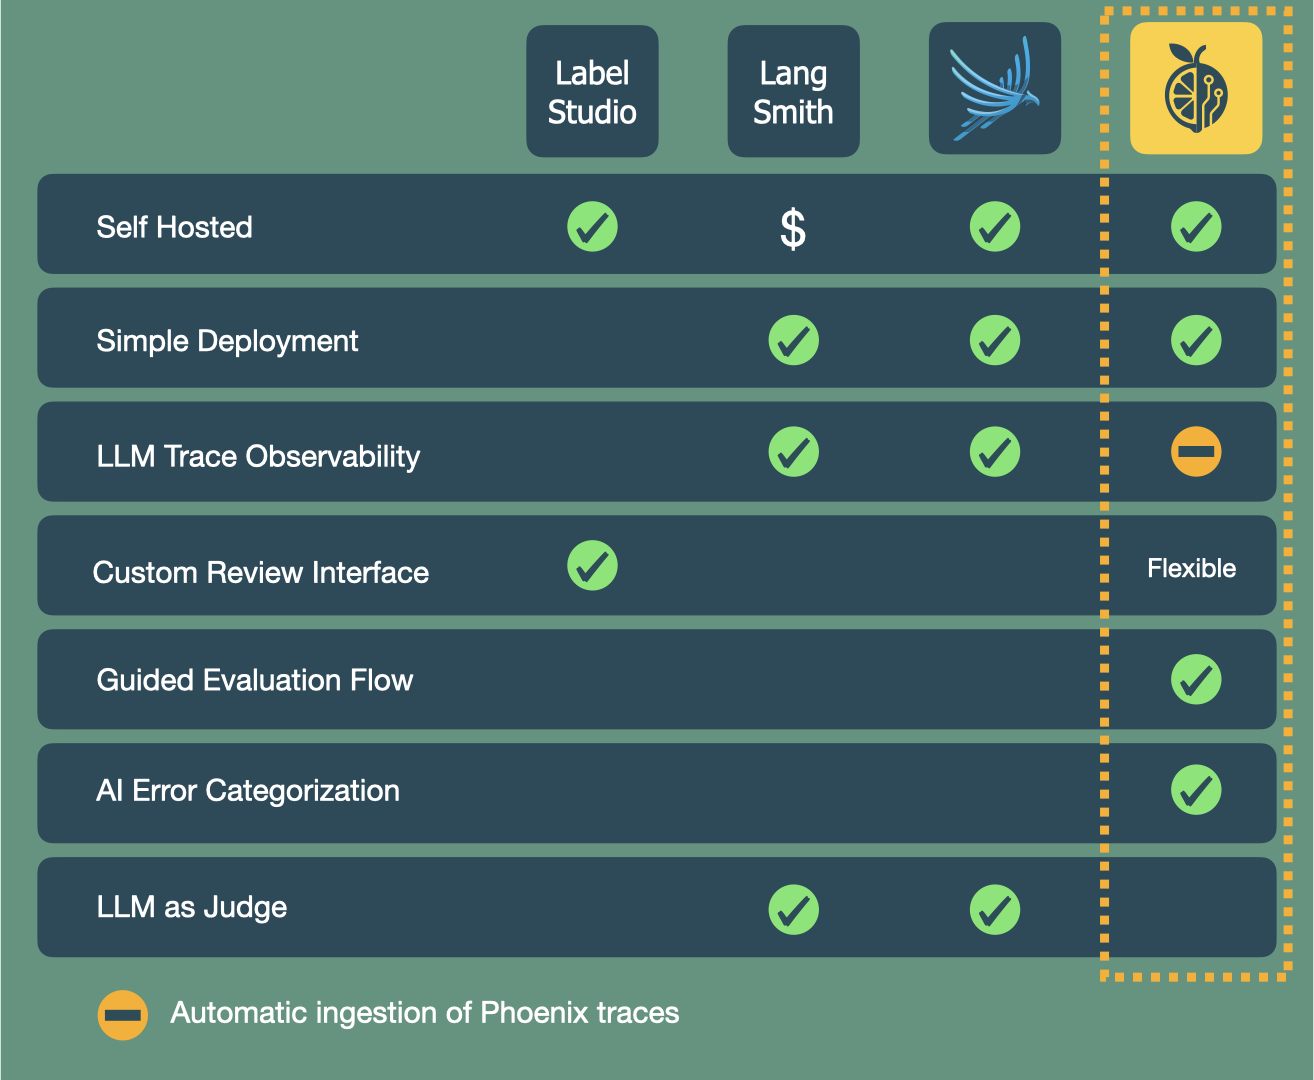
Langsmith and Phoenix are two popular tools that focus on observability and evaluation of AI software. The featuresets of both applications are massive, and include the collection of traces, manual annotations, and automated evaluations with LLM-as-a-Judge. Langsmith is a closed source application that offers a free tier of usage. However, teams utilizing the free tier are not able to self host, and thus, do not have full ownership of their data. Phoenix is open source, has a free tier, and does allow self hosting.
Trade-Offs
Despite being free and including many features, these tools have a steep learning curve. They are ideal for power users and development teams that are experienced with evaluating AI applications. A team newer to evaluations would have a difficult time knowing where to start and how to effectively test and improve their application.
Both software packages include features for annotation, but neither include the kind of human review interface described by Hamel Husain. The annotation screens are busy with lots of extra metadata, the input and output are not shown together at all times, they do not automatically create error categories from free form annotations, and they present trace data as raw, unformatted text.
Data Labeling Software
Label Studio is an open source, self hosted tool for data annotation that can be used for manual error analysis. After importing your trace data into the application, you can evaluate and annotate using its existing templates. A template is a pre-configured or custom-built layout that defines the entire visual interface an annotator uses to label data. Built-in dashboards display results or you can export to a separate tool for analysis.
Trade-Offs
One downside to evaluating an application with Label Studio is acquiring the trace data. Users need to collect their trace data manually (or with an additional tool), export that trace data, and manually import it into Label Studio. This differs from the AI evaluation tools above that automatically observe and import traces with their SDKs.
Additionally, the out-of-the-box evaluation template is missing key features from Hamel's recommended review interface. The evaluations are done on a rating system instead of free form annotation, the outputs are not formatted automatically, and categories are not created automatically from noted errors.
Data Label Studio also offers the option to fully customize a review interface. However, this requires learning Label Studio's XML-like configuration methods. Implementing Hamel's recommended interface features from scratch would be time consuming.
Gap in Service
Existing AI evaluation tools provide the vast feature set needed for large companies and large teams. These teams have the expertise to navigate the complex applications and they know exactly where and how to perform the evaluations. Additionally, they have the resources to connect their existing infrastructure to a specialized data labelling tool or build a custom effective review interface. What is missing is a free, self hosted tool that automatically pulls in trace data, guides the user through the most effective initial evaluation process, and helps the user analyze that data. To bridge this gap, we created LLMonade for small teams to efficiently evaluate and improve their LLM-powered applications.
The evaluation of an LLM-powered application is built upon observability of traces. LLMonade complements the existing evaluation tool, Phoenix, by providing an enhanced manual error analysis interface. We leverage the robust observability of Phoenix to collect the data for LLMonade’s guided evaluations.
Our Solution
Introducing LLMonade
LLMonade is a free, lightweight, self-hosted platform that guides developers of LLM-powered applications through their first evaluations. Our software is designed for small engineering teams that have already instrumented their application with Phoenix. Traces are being collected, but the developers don’t know where to start assessing and improving the quality of their application. LLMonade pulls traces from Phoenix and provides an annotation interface inspired by Hamel Husain’s recommendations. Then, guides the developer through the most important evaluation activity, manual error analysis.
LLMonade is composed of three components:
Full-Stack Error Analysis Web Application
At the heart of LLMonade is a full-stack web application. The application features a simplified error analysis workflow that walks developers through their first manual evaluations. The error analysis is accomplished through an optimized human review interface. This facilitates the viewing, annotating, and analysis of their LLM-powered application outputs.
LLMonade walks users through a simplified five step workflow to quickly get started evaluating their application:
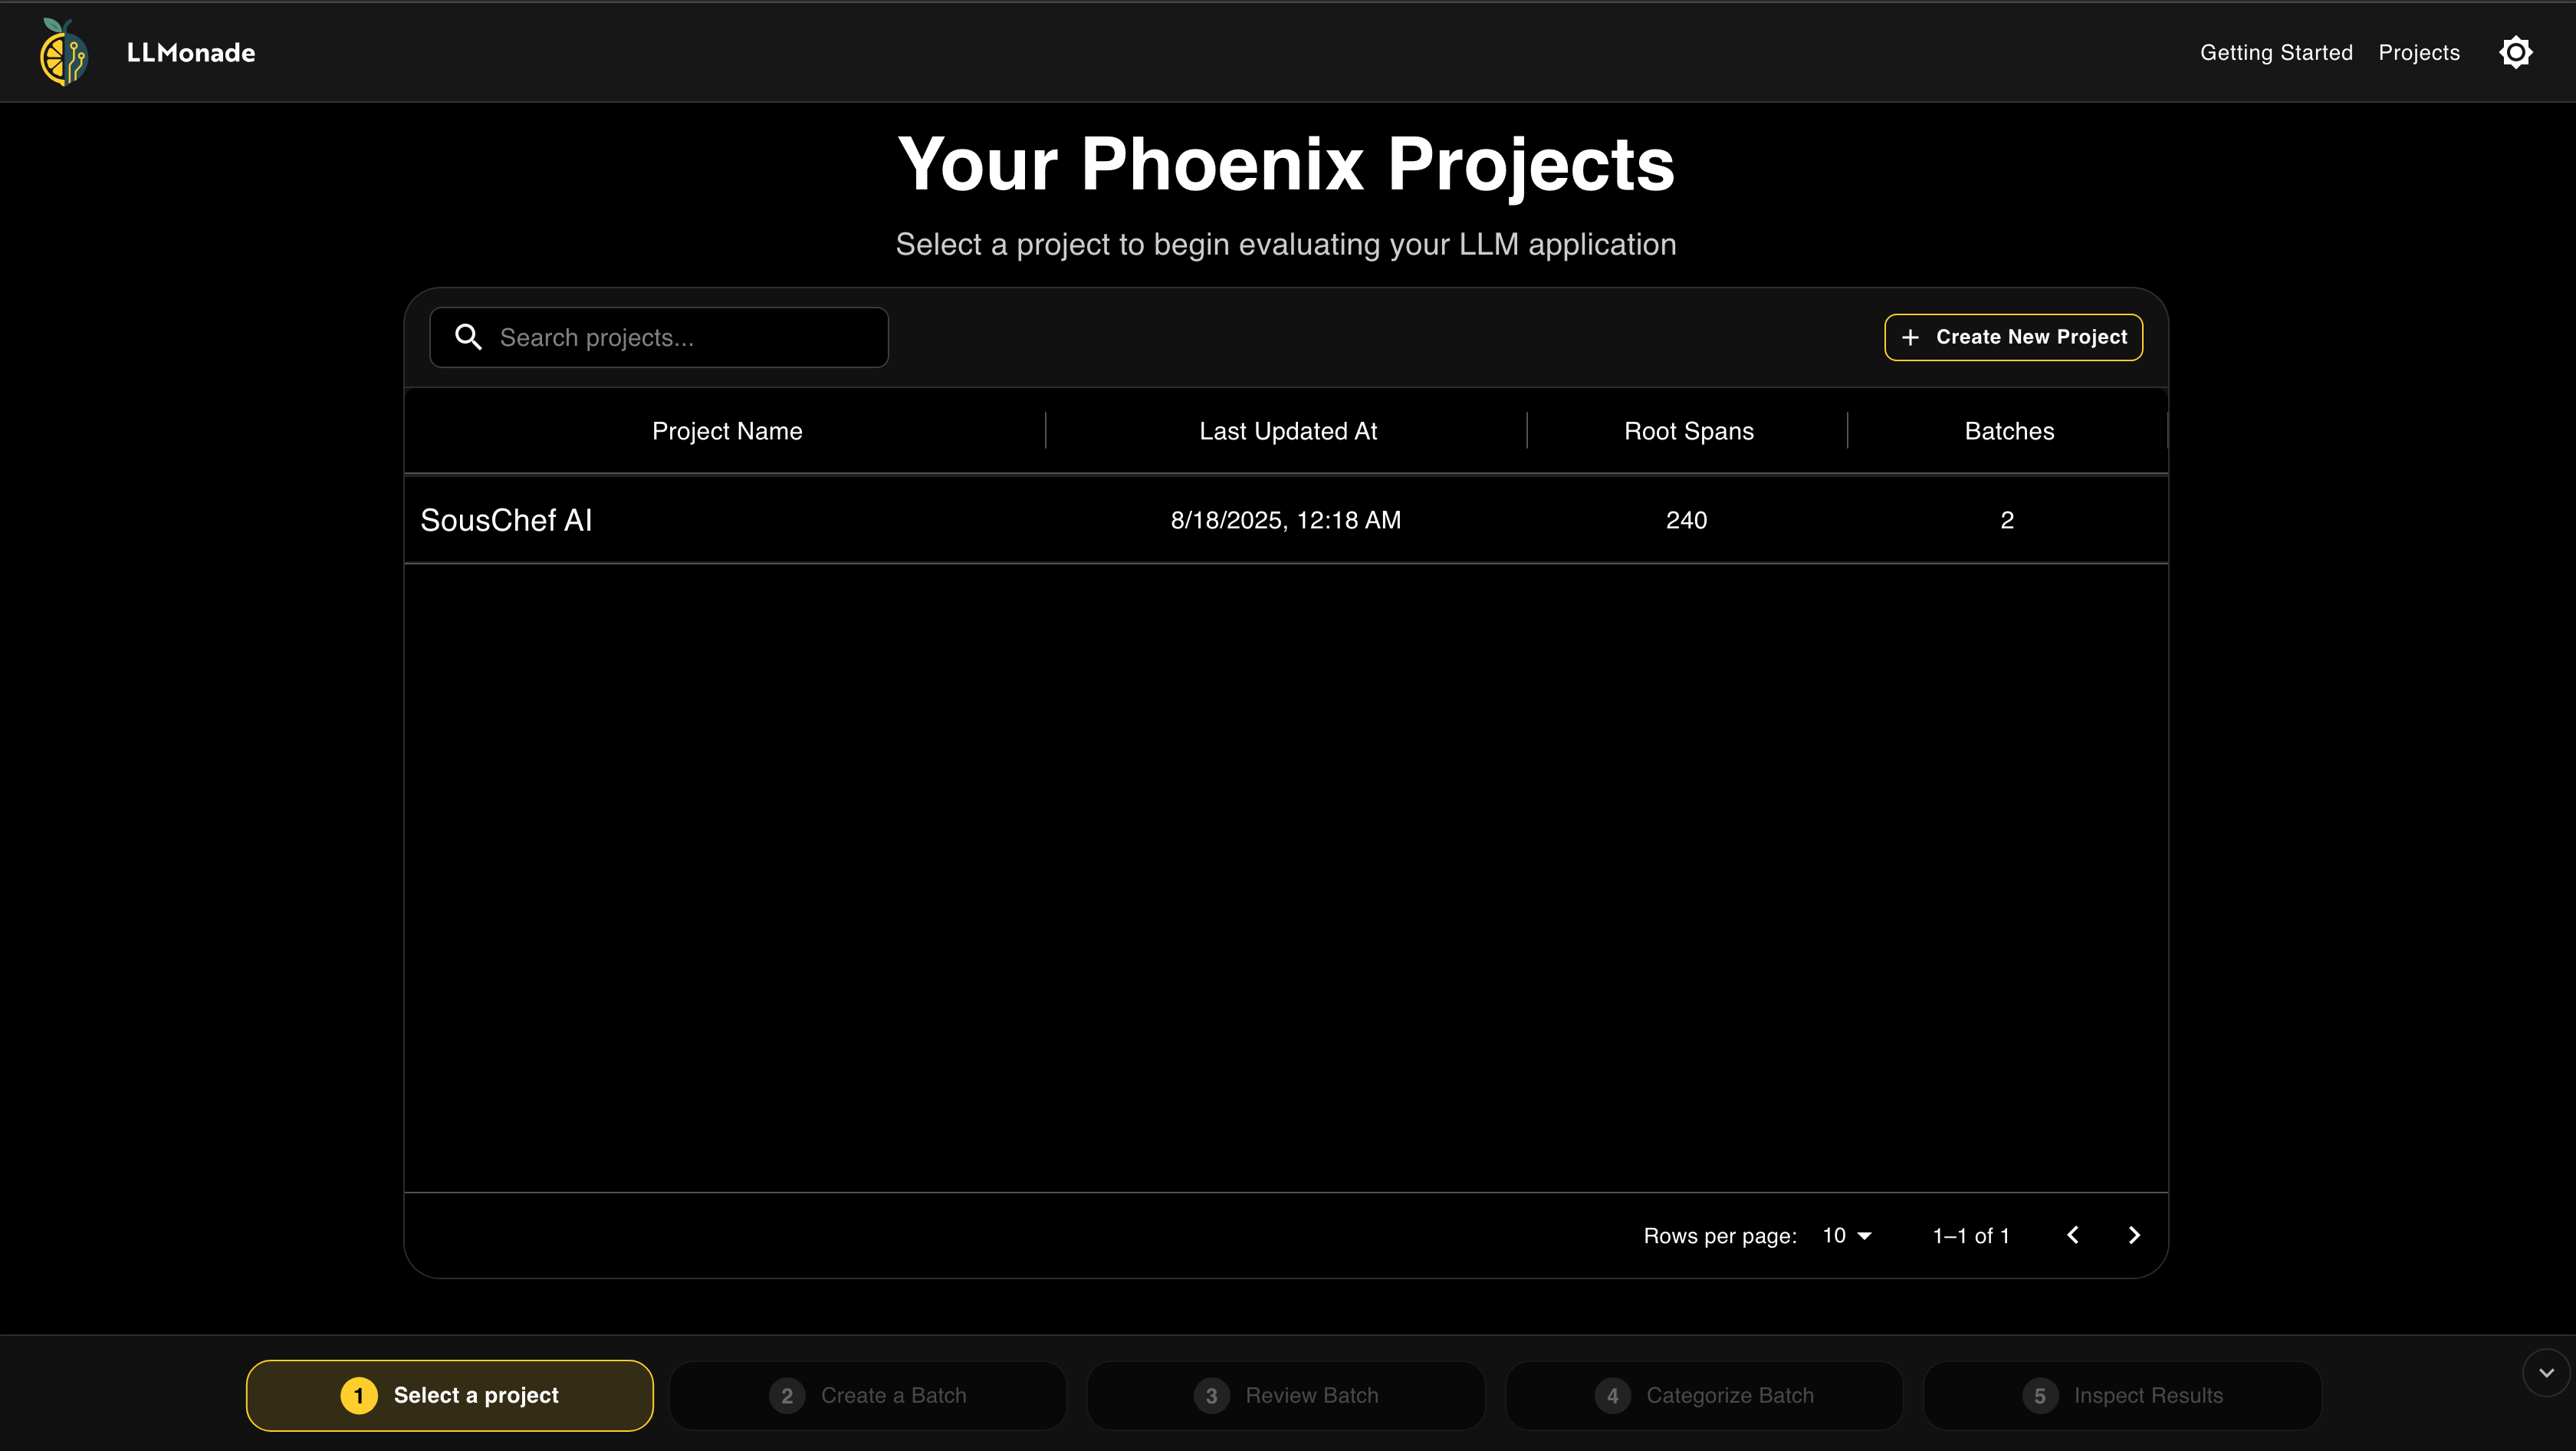
Choose a Phoenix project to get started analyzing.
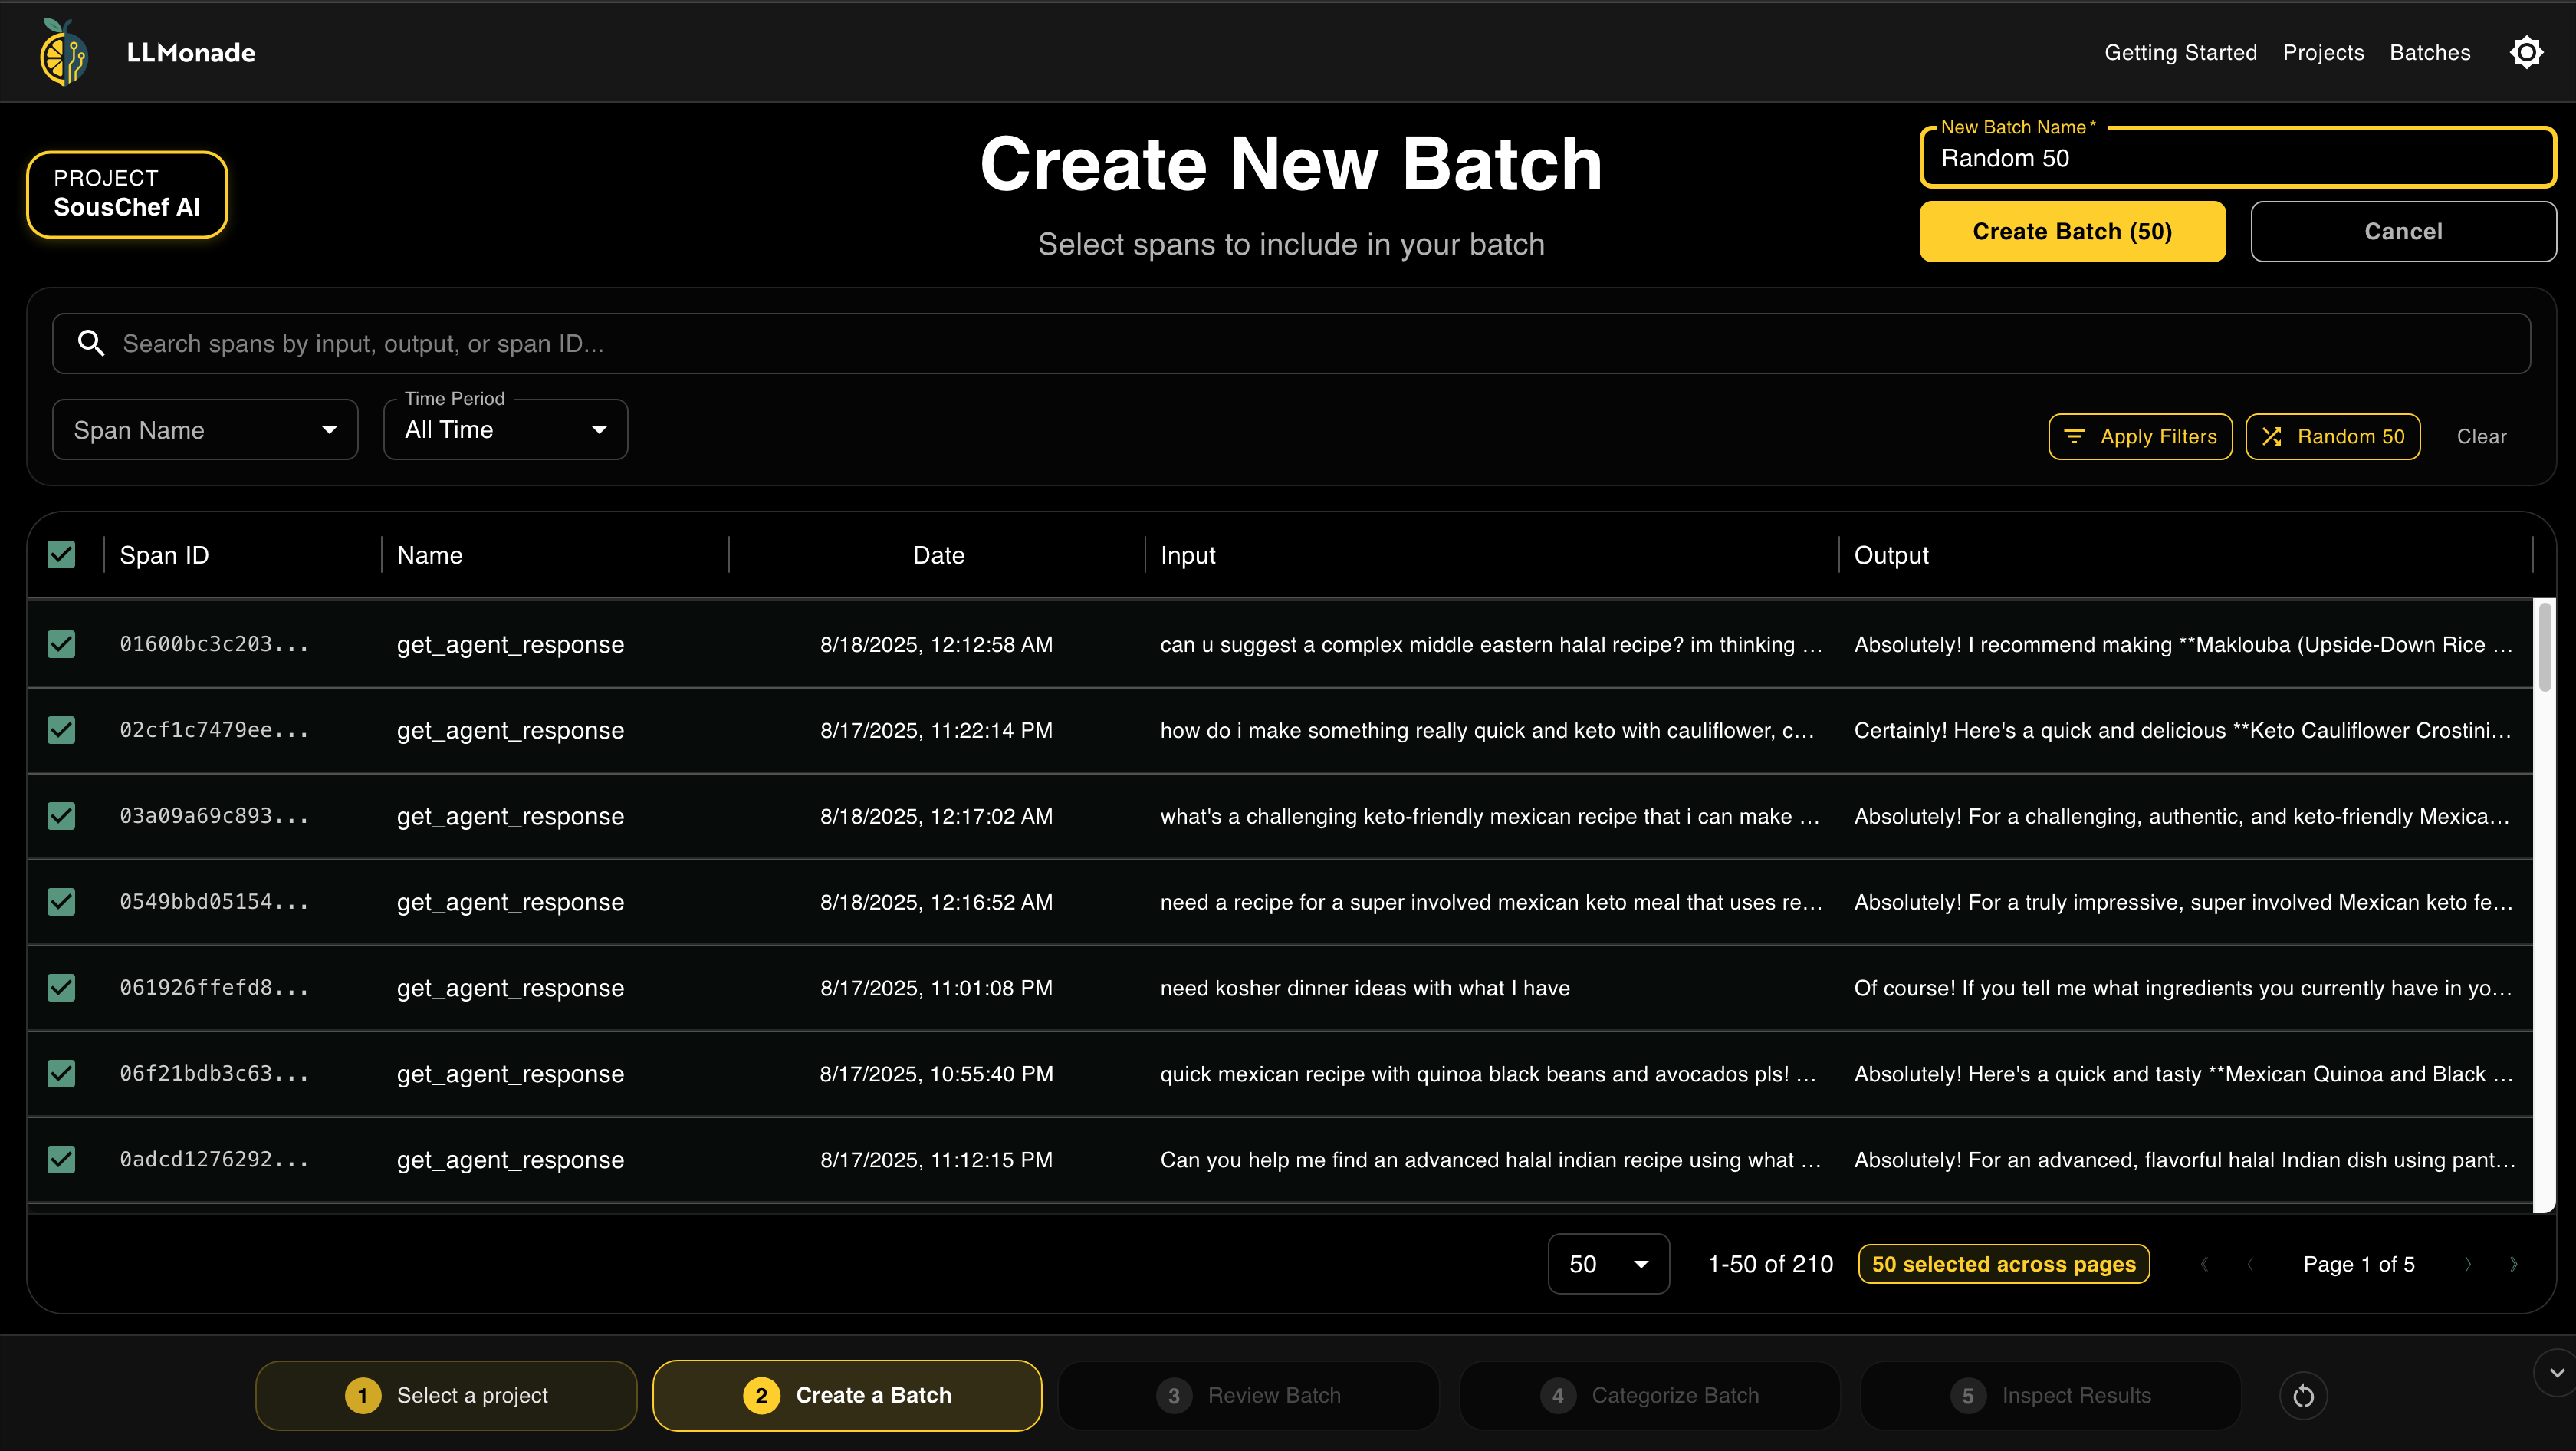
Filter, sort, and select the root spans you want to review.
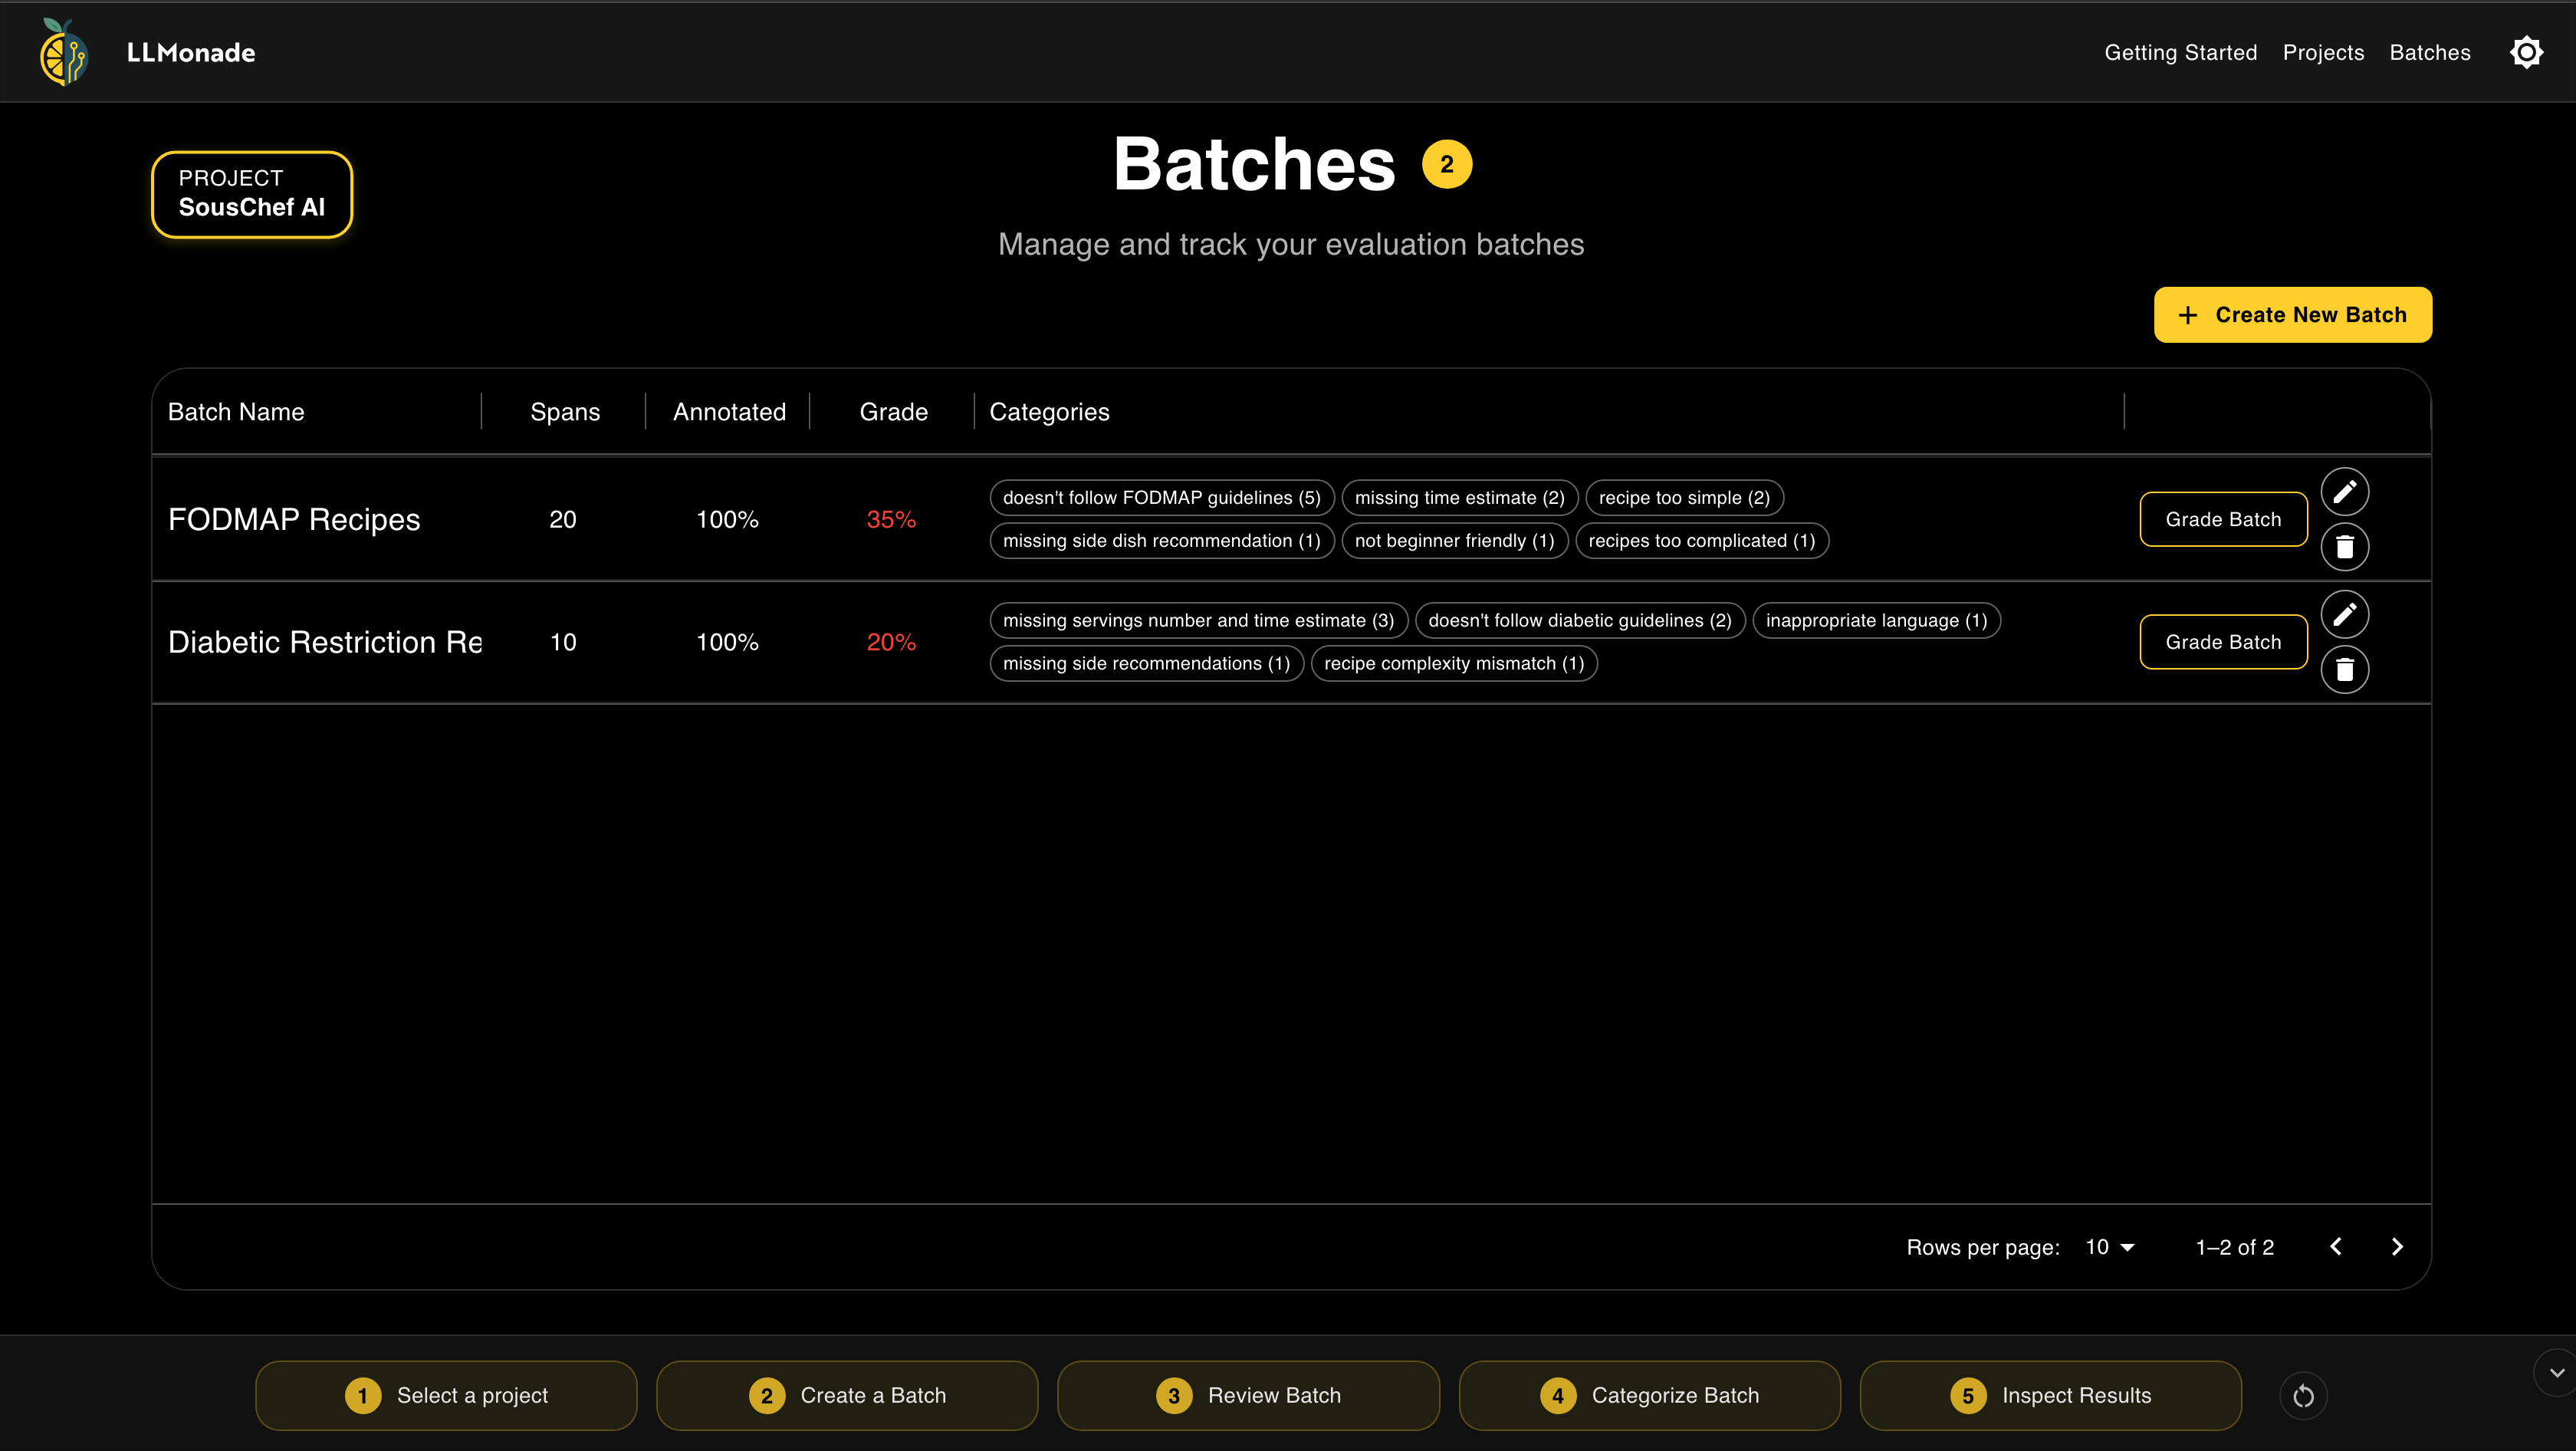
Inspect multiple batches at once and view all categories across batches.
Choose a Phoenix project to get started analyzing.
Filter, sort, and select the root spans you want to review.
Inspect multiple batches at once and view all categories across batches.
This simplified workflow reflects Hamel Husain’s best practices for error analysis. The inspection results provide data-driven targets for developers to focus on. Progress through the workflow is visually tracked in a persistent footer. It highlights the current error analysis step and clearly indicates what comes next, ensuring users new to evaluations can navigate the process with ease.
Effective Human Review Interface
Human review of traces is essential for identifying the most common failure modes in an application. However, manually reviewing root spans can be tedious, creating a barrier to starting this critical process. LLMonade removes this barrier with an efficient platform for faster and easier annotation and analysis.
Root Spans Extract, Transform, Load Pipeline
Looking at real application data is the foundation of manual error analysis. LLMonade integrates seamlessly with the AI observability tool Phoenix. Once deployed, the ETL pipeline automatically ingests existing traces from Phoenix and any new traces that get generated. The highest level spans, the root spans, are formatted and saved to a database. This guarantees that the latest application behavior is always available for error analysis and review in the web application.
Deployment Command Line Interface
The deployment Command Line Interface (CLI) is a tool that automatically spins up all required infrastructure to Amazon Web Services. It utilizes AWS Cloud Development Kit (CDK) to provision and connect the entire architecture without any manual configuration. This makes it an ideal solution for small teams to get started quickly with a self-hosted, AI evaluation workflow.
Architecture
The architecture of LLMonade can be best understood by following the lifecycle of a root span as it moves through the ingestion stage and evaluation workflow. This highlights how each component fits together and how serverless architecture minimizes operational overhead and ensures scalability.
- Trace Generation with Phoenix
- Root Spans ETL Pipeline
- Evaluation Data Persistence
- Error Analysis Full-Stack Application
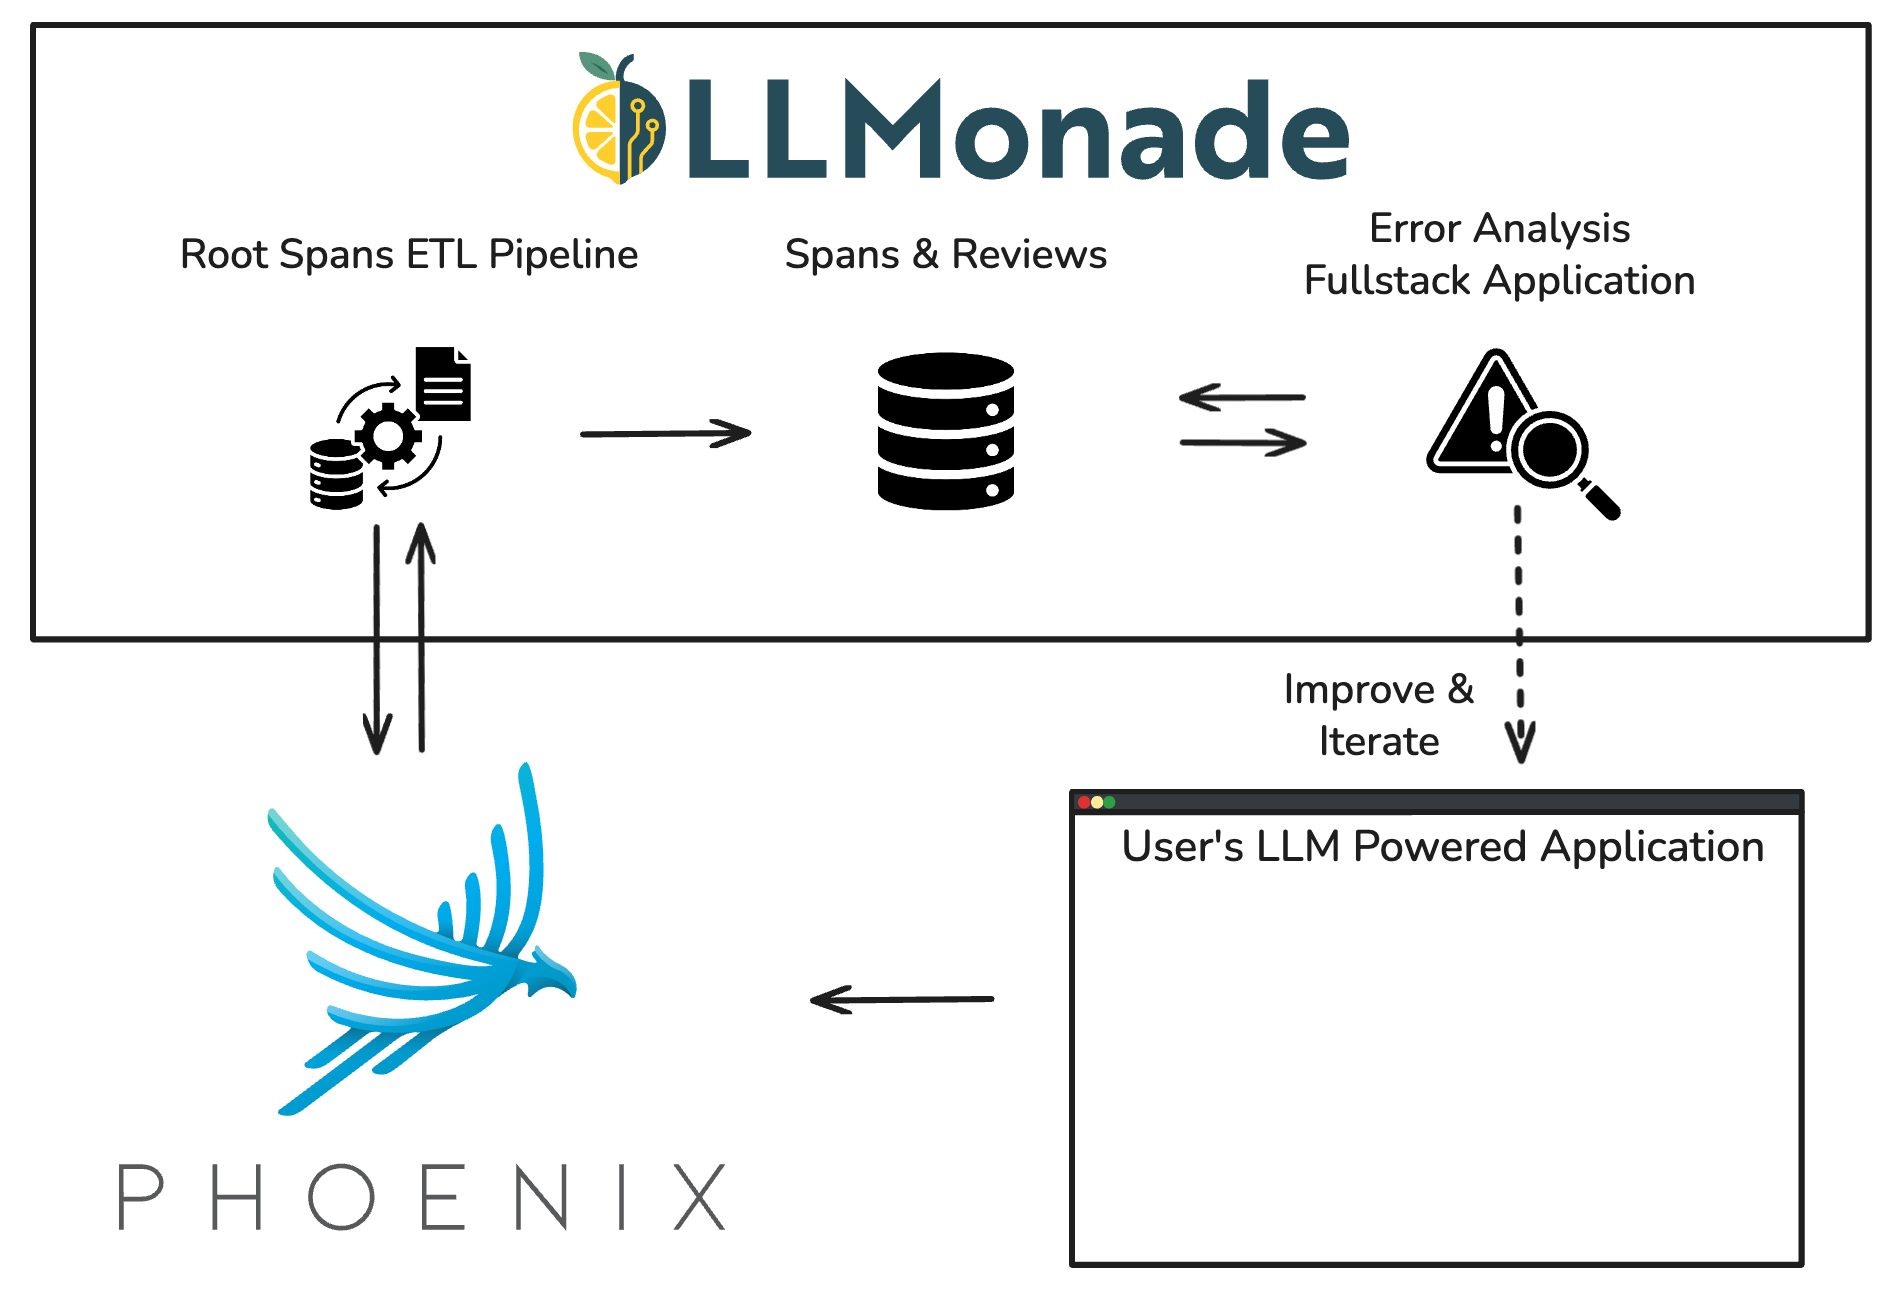
High Level System Architecture
Trace Generation with Phoenix
Traces are generated in a user’s LLM-powered application and are structured, organized, and stored by the observability platform Phoenix. LLMonade builds upon this existing architecture to retrieve the highest level spans, the root spans, from the Phoenix database.
Root Spans ETL Pipeline
The Root Spans ETL Pipeline is a serverless workflow, powered by AWS Lambda, that ingests data from Phoenix and loads it into LLMonade’s database. When LLMonade is deployed, the data pipeline immediately performs API requests to Phoenix and starts ingesting the pre-existing root spans.
ETL Pipeline in Action
To efficiently and reliably handle this ingestion at scale, the pipeline is structured as a two-step process:
- Project Seeding: Phoenix groups traces related to a single application into “projects”. On initial deployment of LLMonade, the pipeline queries Phoenix for all available projects and records them in the LLMonade database.
- Per Project Fan-Out: A new Lambda function is invoked for each project, running independently to ingest that project’s root spans. Each Lambda retrieves spans in pages of 2,000 using GraphQL cursor-based pagination. This ensures sequential progress, prevents re-scanning the entire history of spans, and enables projects to be processed in parallel.
Each page of spans is written to the database in a single batched insert. After a successful insert, the pipeline updates the project’s last cursor position, making the process idempotent and resumable in case of timeouts or failures. After the initial ingestion of root spans, a scheduled EventBridge job runs every 5 minutes, checking for and ingesting new spans. The per project cursor state guarantees that only new spans are fetched, preventing the ETL pipeline from issuing redundant queries.
Evaluation Data Persistence
All ingested root spans and associated evaluation data are persisted in a PostgreSQL database hosted on Amazon Relational Database Service (RDS). The database stores both the raw trace data from Phoenix and associated data generated during LLMonade’s evaluation workflow. This includes formatted span data, batch groupings, grading notes, and custom error categories. A relational model is well-suited for this use case due to the structured nature of spans and associated evaluation data.
Error Analysis Full-Stack Application
When users access LLMonade, they connect through an Amazon CloudFront endpoint. On first access, requests are redirected through Lambda@Edge and Amazon Cognito, which enforce authentication and issue valid tokens. Once authenticated, users are served the React frontend from Amazon S3 via CloudFront, ensuring fast and secure delivery. From there, authenticated requests from the frontend are routed via Amazon API Gateway to the backend API hosted on Lambda.
In addition to the API Lambda, we implemented a dedicated, asynchronous worker Lambda. This Lambda function handles the time-intensive task of formatting spans. When a formatting job is initiated, our primary application API invokes multiple instances of this worker function. This offloads the heavy processing, ensuring the main API remains responsive and available for user requests.
LLMonade leverages a serverless architecture, which is highly cost-effective for periodic workloads like error analysis. The pay-per-use model of AWS Lambda eliminates idle infrastructure costs, while its scalability seamlessly handles concurrent user activity.
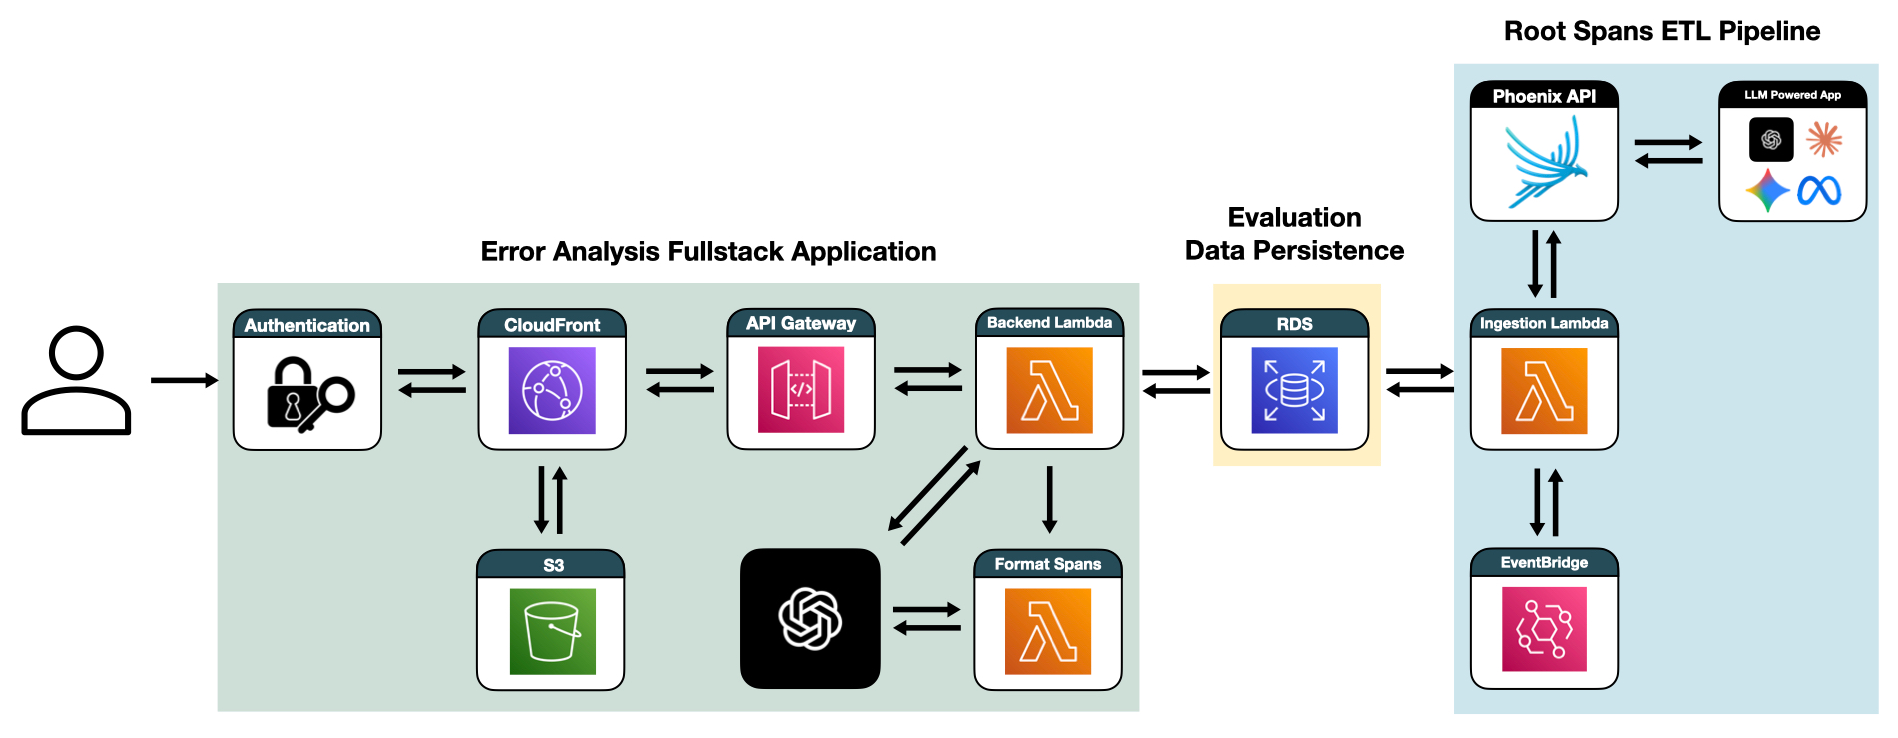
Fullstack Application Diagram
Engineering Decisions
Collecting Root Spans
We needed a reliable, automated way to collect root spans from a user's LLM-powered application. The collection method had to work across diverse environments, minimize integration complexity, and support both current and historical trace data for evaluation.
Options
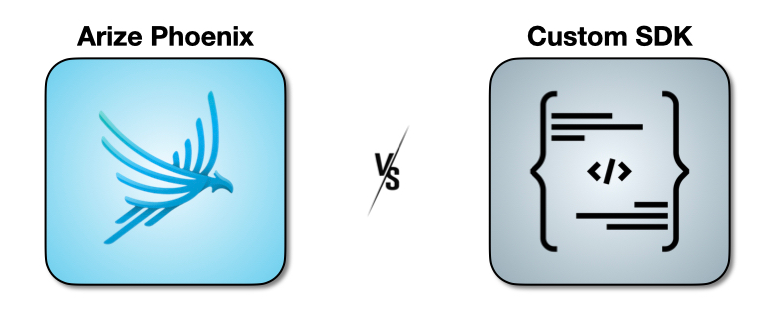
We considered creating our own SDK that users would integrate into their applications to send traces directly to LLMonade. This would provide us with direct trace collection and full control over the ingestion process. However, real time ingestion would not retrieve historical traces. This is a critical shortcoming for teams needing to analyze applications already running in production. Additionally, building efficient trace collection infrastructure from scratch is complex. It would need to handle high trace volumes while maintaining zero performance impact on the user's application.
Many development teams are already utilizing existing observability tools. An alternative option was to integrate our application with one of the most popular choices.
Our Solution
We chose to leverage the proven observability tool Phoenix to collect trace data. Phoenix is open source with no licensing cost or vendor lock-in, supports self-deployment in user environments, and provides well-documented GraphQL endpoints. These features align with LLMonade's own goals of supporting small teams who want to maintain ownership over their data.
Many AI teams have already instrumented Phoenix for observability. This allows us to integrate into existing workflows and create a consistent, dependable ecosystem for LLM observability and evaluation. All of this is achieved without building our own tracing infrastructure. Retaining the users' trace data in Phoenix is a perk of this solution. As our users' applications scale, the detailed findings from error analysis in LLMonade act as a direct blueprint for creating automated evaluations in Phoenix.
Phoenix vs SDK
Trade-Offs
The downside of choosing Phoenix as our trace provider is that it becomes a single point of failure for our application. To ensure an uninterrupted workflow, our application maintains its own replica of the trace data. This decouples our core functionality from the availability of the Phoenix API, allowing users to continue their evaluation tasks even during a Phoenix service disruption. While Phoenix provides a robust foundation for observability, we still needed to bridge the gap between its data store and our application.
Data Ingestion
Adopting Phoenix for observability introduced two ingestion challenges. First, we needed to perform a high-volume backfill of potentially tens of thousands of historical traces. Second, we had to establish a continuous pipeline to retrieve newly generated traces.
Options
One approach we considered was directly streaming from the user's Phoenix database using a pub/sub architecture. This approach would allow for near real-time data streaming, however, it requires users to have Phoenix deployed within the same AWS architecture as our application. Also, it would tightly couple LLMonade with internal implementation details of Phoenix, complicating future efforts to integrate with other observability tools. Lastly, it presents security concerns, as users might be hesitant to grant direct database access to our application.
We also considered allowing users to bulk upload traces via CSV or JSON import files. This would give them complete control over what trace data they would like to evaluate and remove the direct dependency on Phoenix for observability. The downside is that manually exporting traces and manually importing traces would have to be done every time the user has new data. Our target demographic most likely wants to review their recent traces and thus would have to export and import data every time they use the application.
Finally, Phoenix offers a GraphQL API. The API is an officially supported, performant mechanism for fetching traces. This method can be automated while also keeping our application decoupled from the Phoenix database.
Our Solution
We decided to use Phoenix's GraphQL API to handle all data ingestion. When our AWS architecture is initially deployed, a Lambda function is triggered to retrieve all available projects from the user's Phoenix account. For each project, an instance of a separate Lambda function is created to retrieve all traces specific to that project. These Lambda instances operate in parallel, fetching batches of 2,000 traces and processing up to 100,000 total traces per invocation. This prevents any single project from creating a bottleneck in the ingestion process. We also configured the function's Reserved Concurrency to prevent our database from being overwhelmed with connections.
In order to keep trace data up to date, we trigger the same two-Lambda system every five minutes via AWS Eventbridge scheduling. This polling frequency can be easily configured based on the specific needs of a development team. Our Lambda-based approach with Eventbridge creates a completely serverless ETL pipeline with no infrastructure maintenance. It delivers a lightweight and cost-effective ingestion solution which accomplishes near real-time visibility of Phoenix trace data.
Trade-Offs
One consideration is that the speed of our data collection is subject to API rate limiting from Phoenix. We determined this was an acceptable constraint for our target audience of small teams. The rate limit is generous enough that users are very unlikely to encounter it during normal operation. Reaching the limit would require an ingestion volume of tens of thousands of traces per minute.
It is also important to note that our pull-based model leads to some inefficient API calls. The system periodically polls for new information which means it sometimes makes requests when no new data exists. We accepted this behavior because the API requests are free and have a low performance impact.
Flexible Evaluation Platform
We endeavored to create an evaluation tool that works immediately for common scenarios without requiring extensive setup or customization. There are many different types of LLM-powered applications, each with varying complexity and data flows. A simple chatbot involves just a query-response pair, a RAG system might have multiple retrieval steps, or an agentic workflow might involve tool calls and reasoning steps.
Furthermore, depending on the goal of the user's application, the output could have many different content types. Outputs could be emails, code snippets, structured data, conversational text, cooking recipes, or anything else an LLM can generate.
In manual error analysis, the reviewer often needs context beyond the input and output. For example, to review an LLM app that drafts emails for job applicants, the reviewer may need to look at the actual job posting. We needed a uniform way to display the context, even though it could come in many different shapes, sizes, and file types.
Our Solution
To handle the varied types of LLM-powered applications we extracted the root span from traces. The root span represents the primary input and final output of a trace. This technique bypasses the complexity of multi-step LLM chains. It allows the evaluation to focus on the fundamental relationship between what the user asks for and what the application delivers.
LLMonade incorporates an AI feature for automatic content type detection. The system uses AI to automatically identify outputs, like an email or a recipe, and then formats the data for a consistent presentation. Domain experts can review the inputs and outputs in a similar format to how they are meant to be displayed.
We recognized that domain experts often need additional context to make accurate assessments. To support this, we implemented a flexible context window where users can drag and drop PDF documents and images. This feature allows evaluators to view domain specific requirements and nuances directly alongside the inputs and outputs. The entire review process is presented together in a single, unified view.
Trade-Offs
Our standardized, flexible approach involves important compromises that balance simplicity with effectiveness. By focusing on just the root spans, we intentionally hide the internal complexity of multi-step LLM processes. We simplify the annotation screen and thus speed up the process for the reviewer. For users who need deeper insight into their application's inner workings, we provide direct links to the full trace data in Phoenix. This allows them to examine complete process details with a single click when necessary.
Additionally, our AI-powered content detection and formatting can take up to a minute to process for large batches of traces. We recognized that this could slow down the review process. Thus, we circumvent this issue by initially showing users the raw unformatted content while an LLM formats the root spans in the background asynchronously. Once they're ready, the formatted root spans automatically appear in the grading page. This approach prioritizes immediate user access to data while providing enhanced formatting when available.
Our implementation balances user experience with resource efficiency by calling the LLM's API only when users actually view specific root spans. This avoids unnecessarily formatting data that may never be reviewed. Rather than pre-formatting all ingested root spans, we format on-demand. This significantly reduces both API usage and associated costs, while delivering a smooth evaluation experience.
Serverless Architecture
As a tool for small development teams, LLMonade needed to be highly cost-effective, especially for intermittent usage patterns. The system had to scale automatically if there were bursts of user traffic. It also must be secure because the trace data it handles often contains sensitive information. A final goal was to eliminate the operational burden of server provisioning and maintenance.
Options
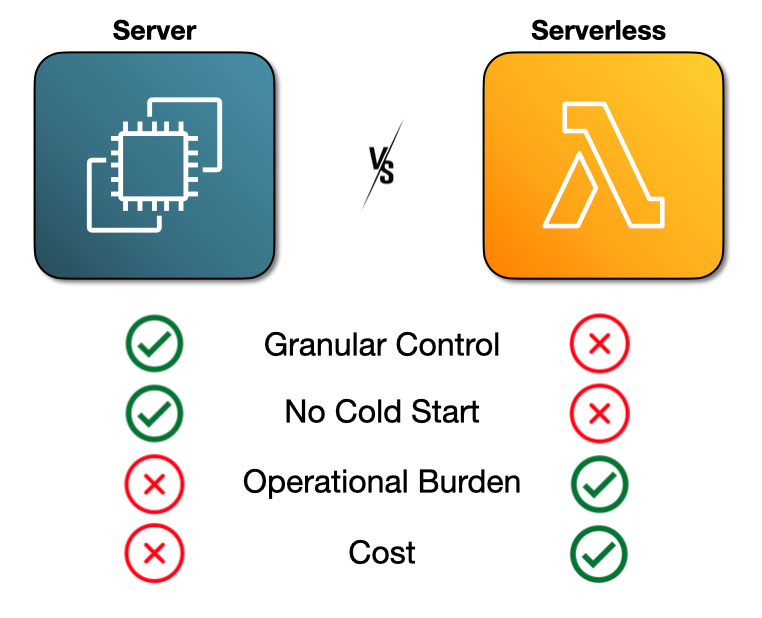
We first considered a traditional Amazon Elastic Compute Cloud (EC2) based architecture, which offers the advantages of granular control and no cold start latency. This approach would introduce the operational overhead of server management and capacity planning, as well as the higher baseline costs of maintaining idle infrastructure.
We also evaluated container-based solutions like AWS Elastic Container Service (ECS) on EC2 and Fargate. These solutions offered better resource utilization than standalone EC2 instances but introduced more operational complexity and higher costs than a serverless architecture. Given our expected variable and low-frequency workloads, using a serverless architecture for the backend was the most cost effective solution.
Our Solution
We implemented a serverless architecture using AWS Lambda functions paired with API Gateway for backend processing. This is complemented by S3 and CloudFront for frontend delivery. API Gateway handles authentication through AWS Cognito integrations. This provides robust security for users' sensitive trace data while maintaining ease of access for authorized users. This serverless approach delivers a true pay-per-use model that automatically scales to meet user demand. The architecture eliminates the need for capacity planning, server provisioning, or infrastructure maintenance while ensuring high availability and performance.
Serverless Architecture
Trade-Offs
Lambda cold starts can introduce additional latency for the first request after periods of inactivity. However, for developers using an evaluation tool, a 2-second cold start is acceptable. The analysis on LLMonade is done asynchronously from the customer facing AI product and thus does not need to be instant. The slight delay is well worth the cost savings from a serverless architecture.
The serverless model also limits our ability to maintain persistent state or long-running processes. This specifically applies to our AI-powered content formatting, which can take up to a minute. To accommodate this within Lambda and API Gateway execution time limits, we designed an asynchronous workflow. It also requires the frontend to poll for status updates rather than maintaining a continuous connection. This adds some complexity to our frontend logic but keeps the backend architecture simple and cost-effective.
Future Work
Integrate with Additional AI Observability Platforms
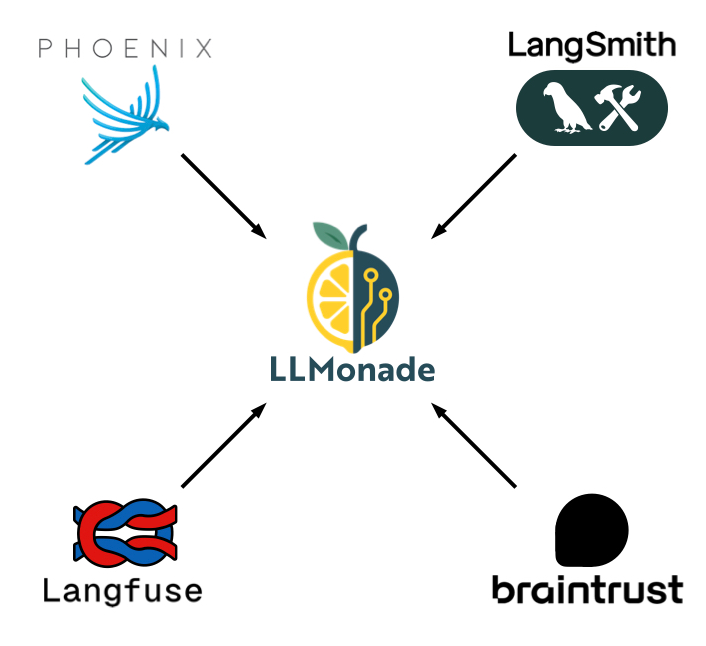
Currently, we only offer our evaluation tool to development teams that have instrumented their application with the Phoenix observability platform. There are many other observability platforms such as Braintrust, Langfuse, and Langsmith that we could integrate with so that users are not locked into Phoenix. In addition to automated trace collection, we would like to offer users the option to directly upload trace data through CSV or JSON files. This would allow any development team, regardless of their observability setup, to use LLMonade.
Expand Deployment Options
Because AI applications are so new, there are many development teams that haven't set up an observability tool yet. In the future, we want to provide an option in our CLI to deploy Phoenix tracing infrastructure within the same AWS architecture as LLMonade. LLMonade would become an all-in-one setup of LLM observability and evaluation.
A key priority on our future roadmap is to enhance our deployment capabilities for security-conscious organizations. We recognize that LLM trace data can contain sensitive information, so we plan to introduce options for stricter network controls. This will likely include the ability to require user access through a VPN.
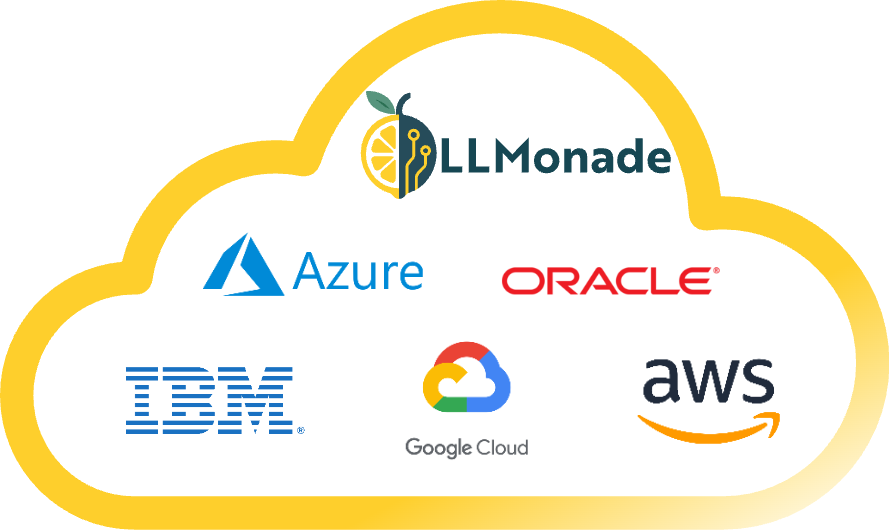
Finally, we recognize that our current deployment process is limited to AWS, which excludes teams using other cloud providers. To address this, a future goal is to transition our infrastructure-as-code from AWS CDK to Terraform, enabling support for platforms like Microsoft Azure and Google Cloud Platform (GCP).
Additional Metadata
Looking ahead, we plan to enhance the capabilities of our annotation viewer. We want to expand beyond the root span to display the full trace, including all nested spans, tool calls, and associated metadata. This would allow the reviewer to find errors anywhere in the chain and also provide more context for analysis.
Currently, the annotation screen offers an extra context window for analyzers to drag and drop a PDF or image. We want to add the capability to upload more file types, input a URL, or make an API call here. Additionally, we would like to make the input, output, and context windows resizable and movable.
Synthetic Data
In the future, we would like to support pre-production evaluation. We plan to introduce a feature that helps users generate synthetic datasets tailored to their application's use cases. This will allow teams to run their LLM application against these inputs and seamlessly ingest the resulting traces for immediate error analysis–enabling them to find and fix bugs before launch.
Automated Evaluations with LLM-as-a-Judge
Our long-term vision is to help users graduate from manual error analysis to continuous, automated evaluations. We plan to build features that allow teams to use their curated error analysis results as a foundation for an automated regression suite. By leveraging an "LLM-as-a-Judge" model, this system will ensure that output quality remains high as changes are made to their application. This feature would allow users to start out with a simplified error analysis workflow and gradually transition to an automated evaluation system with guidance at every step.
References
References
- Data Flywheels for LLM Applications: Shreya Shankar
- A Field Guide to Rapidly Improving AI Products: Hamel Husain
- An LLM-as-Judge Won't Save The Product—Fixing Your Process Will: Eugene Yan
- What are Traces?: Phoenix by Arize AI
- Create Strong Empirical Evaluations: Anthropic AI
- What We've Learned From A Year of Building with LLMs: Eugene Yan, Bryan Bischof, Charles Frye, Hamel Husain, Jason Liu, Shreya Shankar